PacketFence - BTS - PacketFence |
| View Issue Details |
|
| ID | Project | Category | View Status | Date Submitted | Last Update |
| 0001359 | PacketFence | web admin | public | 2012-01-09 13:08 | 2015-02-18 10:55 |
|
| Reporter | fgaudreault | |
| Assigned To | | |
| Priority | normal | Severity | tweak | Reproducibility | random |
| Status | closed | Resolution | open | |
| Platform | | OS | | OS Version | |
| Product Version | 3.1.0 | |
| Target Version | | Fixed in Version | | |
| fixed in git revision | |
| fixed in mtn revision | |
|
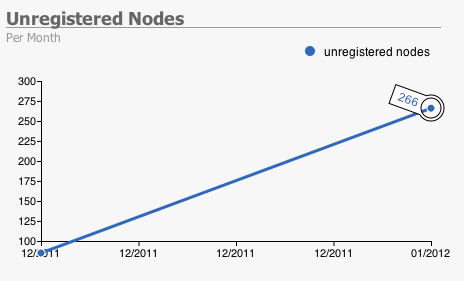
| Summary | 0001359: Graphs presentation issue |
| Description | On some occasion, graphs are not rendering properly. I believe this is happening when we have not a lot of data in PF.
See the screenshot for an example. In this SS, the data line goes below the axis to reach the proper number. |
| Steps To Reproduce | |
| Additional Information | |
| Tags | No tags attached. |
| Relationships | |
| Attached Files |  Screen Shot 2012-01-09 at 1.06.30 PM.png (20,365) 2012-01-09 13:08 Screen Shot 2012-01-09 at 1.06.30 PM.png (20,365) 2012-01-09 13:08
https://www.packetfence.org/bugs/file_download.php?file_id=124&type=bug
|
|
| Issue History |
| Date Modified | Username | Field | Change |
| 2012-01-09 13:08 | fgaudreault | New Issue | |
| 2012-01-09 13:08 | fgaudreault | File Added: Screen Shot 2012-01-09 at 1.06.30 PM.png | |
| 2012-01-09 13:09 | fgaudreault | Description Updated | |
| 2012-10-19 12:38 | fgaudreault | Target Version | => general |
| 2015-02-18 10:55 | lmunro | Note Added: 0003872 | |
| 2015-02-18 10:55 | lmunro | Status | new => closed |